Data in Action – Small Data is King in Water Sustainability

By Peter Williams – AQUAOSO Advisor
Somebody once said that “big data” is misnamed – it should really be called “small data”. What they meant is that in both spatial and temporal terms, measurement points are becoming ever more frequent, so that it is becoming possible to know about ever smaller units. The “big data” part refers to the fact that this is happening at an enormous scale.
This is certainly true in the water sector, where one of the most interesting and important trends is that of granularity of measurement. Spatially, it becomes possible to measure and analyze say, parcels, or sub-segments of parcels, or perhaps an individual tree or vine from a planting that could have many thousands. Temporally, all measurement scales seem to be moving towards continuous (real-time): what used to be weekly is becoming daily, what used to be daily is becoming hourly and what used to be hourly is becoming continuous.
Water data granularity is being driven by three underlying factors:
- First, the power of senors continues to grow while the cost decreases.
- Second, there is the ability to integrate sensor data and multiple additional data sets to create composite pictures of the world.
- Third, we have the ability – with or without artificial intelligence – to analyze that data to produce useful insights and predictions.
One company that seems to me to embody these trends and show where they might lead is AQUAOSO. AQUAOSO’s mission is to enable water risk to be assessed and monitored, with their principal focus being the agricultural sector. The company is doing well – it is well-established in California and has recently expanded to Washington and Oregon. But what is fascinating, as they have built their risk management platform, is how they have capitalized on the trend to granularity to offer ever more specific insights.
AQUAOSO – Small Data Granularity in Action

Not long ago in California, if you wanted to understand water risk for a given land parcel, you were faced with a mish-mash of Federal, state, and local records, with perhaps some private data on things like parcel boundaries. These data sets would have had missing or inaccurate records and they may or may not have been consistent with one another. Data on groundwater levels at a given location might simply not have been available as there was no legal requirement for a landowner to provide it. The 2014 Sustainable Groundwater Management Act in California put an end to that situation, but it still needed sustained focus to assemble the available data into something useful. This is what AQUAOSO has provided.
AQUAOSO has assembled, for any given land parcel (or portfolio of parcels) in the state, a composite picture of water risk from 20+ state-specific data sources comprising:
- A GIS base layer (topology, physical layout)
- Data from relevant Groundwater Sustainability Agencies (GSAs) and Groundwater Sustainability Plans (GSPs)
- Water district deliveries
- Water rights and seniority
- Specific water well – location and recorded depths
- Soil type and suitability for groundwater recharge;
- Groundwater depth and water quality
- Crop types
- Endangered species zones
- Land ownership
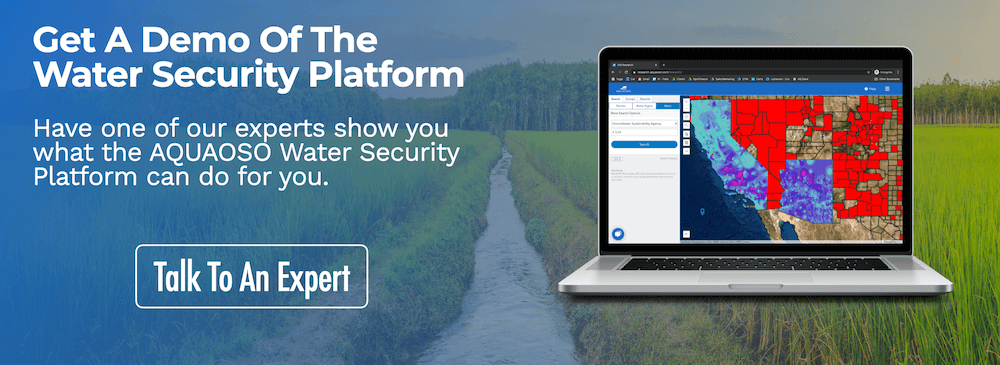
These factors are assembled into a Water Security Platforom. As a result, for any given parcel in California, you can now assess the complete water risk situation – water rights status, groundwater availability, supply variability, crop requirements, historical situation, and trends. What might once have taken hours now takes a few moments.
That’s the “small data” part. Now let’s think about the “enormous scale” part – the “big data”. First, it becomes possible to build a water risk position “bottom-up”, by aggregating the picture for multiple parcels. This applies to portfolios or collections of parcels selected by any combination of ownership, location, crop type, and so on. It also applies to the state as a whole – an aggregated California-wide picture of water risk. Going further, AQUAOSO is now, as stated, commencing operations “bottom-up” in Oregon and Washington, and will be able to expand into other states thereafter. This of course opens the scale aperture to providing aggregated pictures to the whole of the Western United States, and eventually beyond.
But all this is just following the spatial axis of granularity. What about the temporal axis? Water risk exists in different timescales, after all. Droughts follow millennial, centennial, or decadal cycles; and relevant information about water risk can apply 6 months out, too – how much rainfall, or how much streamflow will there be for this crop cycle, and what will the yield be? Products are now coming to market that start to offer this level of granularity. Likewise, water budgets are a temporal concept – an allocation of water to be applied to the land over a period of time. AQUAOSO’s platform is positioned to integrate this level of temporal granularity with the spatial focus that it has already achieved.
To Conclude
AQUAOSO represents a compelling example of the dynamics of big data and how it really adds value through “drilling down” to ever greater levels of granularity, before aggregating back up to larger scale insights. Take a look at AQUAOSO’s Water Security Platform, the industries they work with, and the regions they serve.